Understanding performance of the eyeo Browser Ad-Filtering Solution – Part 2

In part 1, we’ve talked about why the performance of ad filtering is important for us and the performance metrics we decided to measure.
In part 2, let's dive into how to measure those metrics and what we can do with the results.
Learning how to measure
When we started running performance tests, we discovered that the results were wildly inconsistent. There were several reasons:
- The content of the website changes daily - and the ads change even more dynamically. This means that if we ran the same benchmark 10 times, we would experience 10 different sites.
- The results vary depending on the device. Chromium will be more thrifty with memory allocation depending on how much RAM your phone has available and a faster processor will speed up page loading.
- Chromium runs “field trials”, a method of A/B testing –– they can kick-in randomly and affect a test run.
- Network speed has a large impact on page loading time. A hiccup in the Internet connection can throw off a measurement.
- The mobile phone can throttle down its CPUs to save battery, or to dissipate heat.
We had to address all of these problems before we could gain trust in the numbers.
We’ve set up a “device farm” that contains several identical phones (we cross-checked their real-life performance) and designated them as the authoritative source of data –– no more at-home testing with random devices. We made sure all phones are configured with a “full power, don’t conserve battery” profile to avoid throttling. This required flashing them with non-standard, development Android images.
Then, we experimented with Android emulators running on PCs but they were even less consistent and poor at representing performance of real, physical devices.
So we started using Web Page Replay. It’s an ingenious way of solving both the variability of websites’ content and the fluctuations of network load. You visit a live website once, record all requests the browser sent and all responses it received, store them in a file and then replay them during test runs, with predetermined latencies. You don’t even need a live internet connection anymore.
We also disabled field trials in our builds, making sure they weren’t a random factor and established a set of build flags that deliver most consistent results, via trial and error.
Even then, there was some unavoidable variance between runs and we had to analyze this setup with our data team to identify how many runs we need to produce statistically significant results and how many outliers to discard.
Tracking and visualizing
Trustworthy performance numbers are great, but they alone don’t make the software efficient.
The next step was to weave those measurements into our software development process, in a way that lets us track performance over time and find regressions.
The solution:
- Ensure performance tests are triggered nightly, and additionally for every release, release candidate, beta, etc.
- Individual tests upload their results to Google Big Query
- A dashboard visualizes the data, both as a time-series overview and as a breakdown of individual run results
Here some screenshots of that dashboard, along with explanations of what they show:

Vertical axis is in megabytes. Red line: Chromium with ad filtering. Blue line: Stock Chromium
What we learned is that the metric on the left indicates that ad filtering “costs” around 15 MB of memory, but the one on the right indicates there’s pretty much no difference. This shows the importance of choosing the right metric - our optimization efforts are guided by the graph on the left.
Around 10 May 2023, there was a bump in memory consumption. It was a regression in Chromium that wasn’t caused by our ad filtering code and has been fixed since. This shows that we need to be careful of how external factors influence performance.
Anomalies always happen in long-running systems and it requires a human eye to explain them, case by case. Around 22 June 2023, there was an anomaly – an infrastructure problem on our end which wasn’t a product bug.

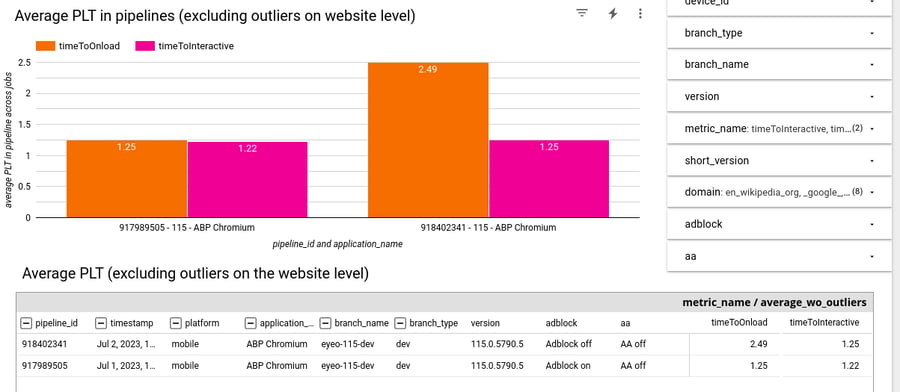
Vertical axis is in seconds. Orange bar = “time to onload”, the metric that tracks how long it takes to finish loading the page.Pink bar = “time to interactive”, or how long it takes before the page can accept clicks and scrolls.
On the left is Chromium with ad filtering enabled, and on the right is stock Chromium with no ad filtering.
What we see here is that both metrics are lower (better) with ad filtering enabled - This goes to show that ad filtering does make pages load faster!
However, it wasn’t always like this. Our team has spent over two years optimizing our solution to this state. Early versions of our code were slower than stock Chromium.
Ad filtering does not guarantee better performance unless it’s implemented really well, and that requires measuring, optimizing and repeating.
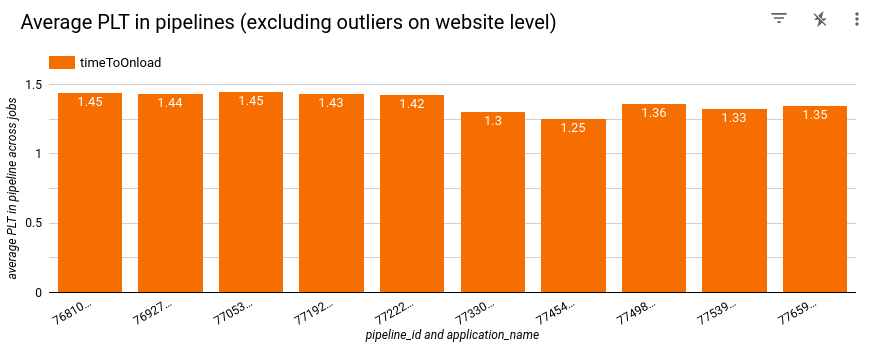
Example: Page loading time improving after integrating an optimization

This is a time-series of nightly performance tests, showing the “time to on load” metric, in seconds. In the middle of this time period we integrated a performance improvement, which shows up in the results.
Synthetic, isolated benchmarks of the optimized code showed that this particular fix yielded a 100x improvement in ad classification speed! But since ad classification is just a tiny component of the overall website rendering time, this translated to around a 5-10% real-life improvement.
This shows you can’t base your claims about efficiency on purpose-written benchmarks (which we have too!), you need to know the big picture as well.
Optimizing is a game of increments.
Turning it into a process
Once all those pieces are in place, the last part is embedding performance measurement into our development process.
We did it by:
- Having a rotational CI Sheriff role in the team who’s responsible for investigating regressions, anomalies, infrastructure failures, nightly performance tests that didn’t run
- Maintaining close relations with the DevOps from our infrastructure team, to ensure outages are handled promptly
- Automatically running large-scale tests (on dozens of recorded websites) on every Release Candidate, in addition to the regular nightlies
- Making sure a human looks at the results before a release, as a final check
- Prioritizing performance improvement tasks similar to new features or refactoring tasks
- Perf-testing branches that introduce new features before they are merged, to know their impact beforehand
The result
Implementing this performance-driven approach to development changed eyeo Browser Ad-Filtering Solution profoundly.
We rewrote it from scratch, in C++ – it no longer embeds a JavaScript filtering engine and it’s multi-threaded. It can access filter lists via memory-mapped files to save RAM and stores parsed filters in a zero-overhead binary format that lets it start in milliseconds.
Overall, it consumes less memory when using full filter lists than the original solution did with minified lists. It took a lot of effort but it was worth it in the end.
Although this is a significant achievement for us, the work is not completed. Maintaining state-of-the-art performance is not a job you finish, it’s an ongoing process that requires sparks of innovation and laborious statistical analysis, updating tests, troubleshooting misbehaving servers and cultivating a team culture that puts value on all those things.
If you’d like to learn more about eyeo Browser Ad-Filtering Solution, the code is available on gitlab for you to take a look at and it’s free (as in freedom) software.
Get in touch here if you’d like to use it in your browser and we can discuss the terms of a commercial license.


